Live map
Live air quality map
Fine-dust (PM2.5) readings from thousands of citizen sensors, coloured by how clean the air is. Turn on fires to see where smoke is coming from.
Free · No sign-up · Works in any browser
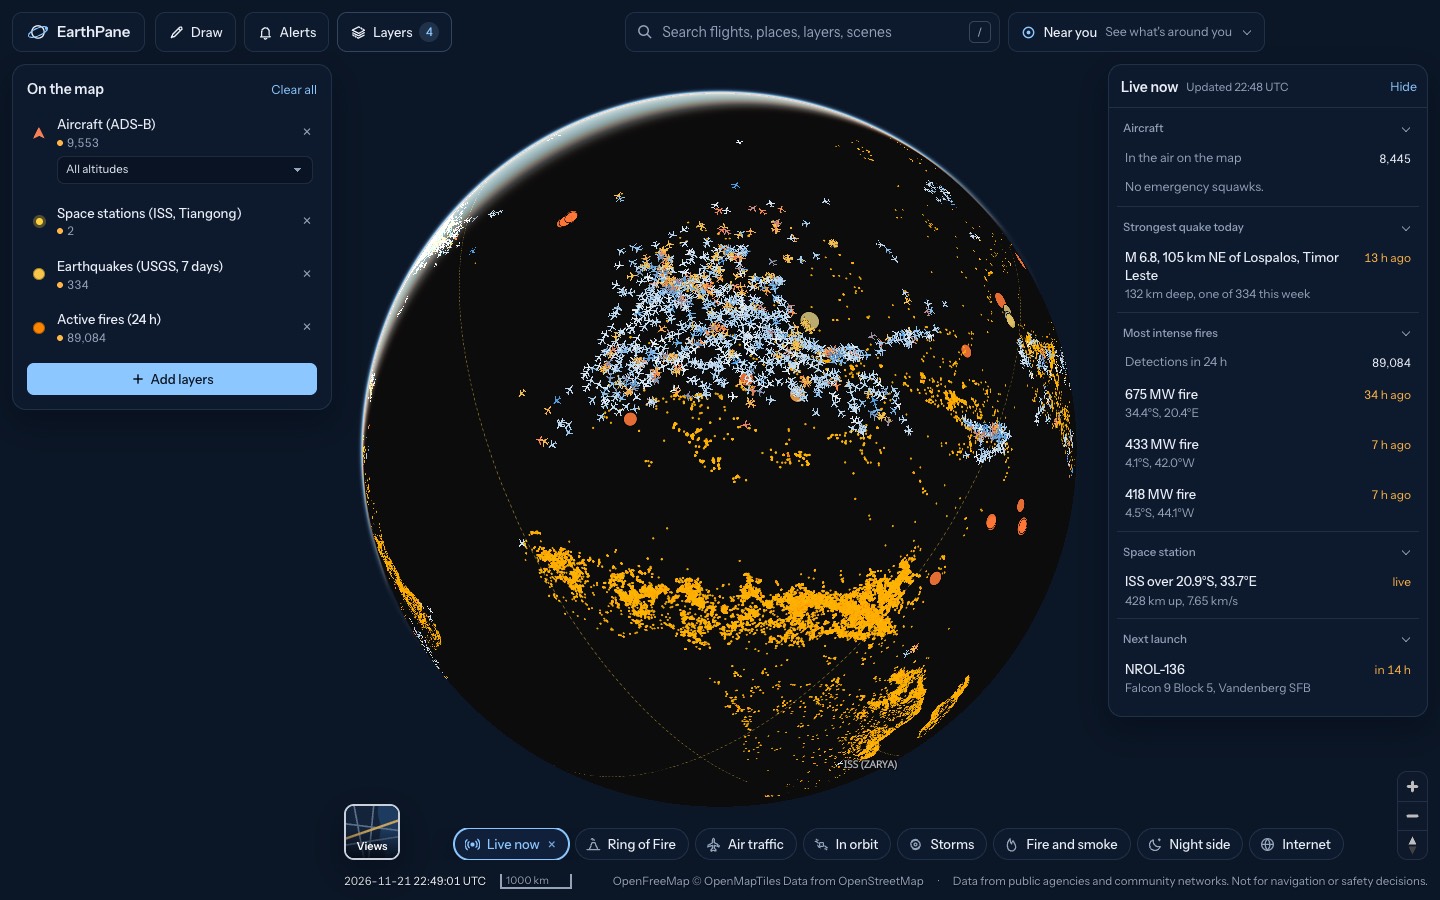
What's on the map
- Air quality (PM2.5)Fine-dust readings from citizen sensors
- Active fires (24 h)Fires detected by satellite in the last 24 h
How to use it
- Open the map. Each dot is a sensor, coloured from clean to very polluted by its latest PM2.5 reading.
- Search for your town or tap Near you to see the sensors closest to you.
- Set an alert in Alerts to be told when PM2.5 near you passes a level you choose.
Questions
Where does the air quality data come from?
From sensor.community, a network of low-cost particle sensors run by volunteers. Coverage is densest in Europe and thinner elsewhere.
How accurate are citizen sensors?
Good for spotting trends and smoke events, less precise than official monitoring stations, especially in fog or high humidity. Follow official air quality advice for health decisions.
What is PM2.5?
Particles smaller than 2.5 micrometres, from traffic, heating, industry and smoke. They reach deep into the lungs, which is why they are the main measure of air pollution.
More live maps
Live wildfire map
See active fires worldwide detected by NASA satellites in the last 24 hours, US fire perimeters and smoke on a free live map.
Live weather radar
Free live weather radar map showing rain and snow, plus wind, temperature and satellite cloud imagery on a 3D globe.
What's above me right now?
See what is flying above you right now: planes, satellites, the ISS, plus nearby quakes, fires and storms.